Concerning spreading of bovine TB in edge areas.

The goverment of the Uk did release the last quartal figures about the situation of bovine TB obtained from APHA.
https://www.gov.uk/government/statistical-data-sets/tuberculosis-tb-in-cattle-in-great-britain

Maximise the graph

The figures show that  in high risk areas the top is obviously reached. Since 2012 it is moving between 10% and 12% prevalence. In the edge areas however it seems that bovine tb is spreading unrestrained. We are now at about 5% prevalence. This means that edge areas will sooner or later become high risk areas and the amount of regions with high herd prevalence ist growing. So far there are no signs of a sucsessful control of bovine TB. 

The herd prevalence is calculated by breaking the amount of herds under restriction through the amount of all herds registered on SAM. To get a percentage figure you have to multiply with hundred. 

You can find the the concerning dataset here: https://assets.publishing.service.gov.uk/government/uploads/system/uploads/attachment_data/file/763660/bovinetb-gb-countries-12dec18.ods

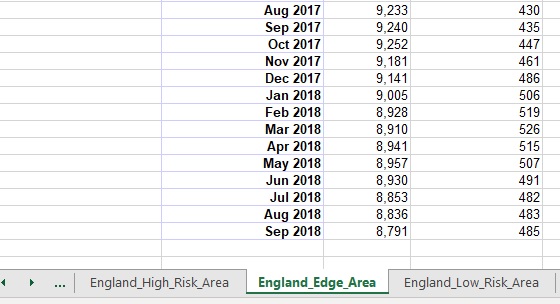
Select the Edge Area Sheet in the file and go to the columns:

“Number of cattle herds registered on Sam” and

“Herds not officially TB free at the end of the period due to a bovine TB incident”

Maximise the graph

Then scroll down to the rows with the monthly figures:
Maximise the graph

The Excel file the graph above is created with: 

http://wf2g2bm3y.homepage.t-online.de/0012/wp-content/uploads/2018/12/st1.xlsx
 

How to measure the effect of badger culling

When measuring, we should  use units, that are used to measure the goals we set.

George Eusticen   Minister of State for Agriculture, Fisheries and Food of the UK formulates a goal in the “Written statement – HCWS963”:

https://www.parliament.uk/business/publications/written-questions-answers-statements/written-statement/Commons/2018-09-13/HCWS963/


“I want to update the House on the implementation of the government’s strategy to eradicate bovine TB in England by 2038.”


I am not sure what kind of definition of “eradication of bovine Tb” George Eusticen is using, I suggest to agree on “prevalence under 1%” as it is in Scotland since ages.

How can we define “prevalence of bovine Tb” within a population of cattle herds?

I suggest: “The part of herds with not OTF-status of the whole population”


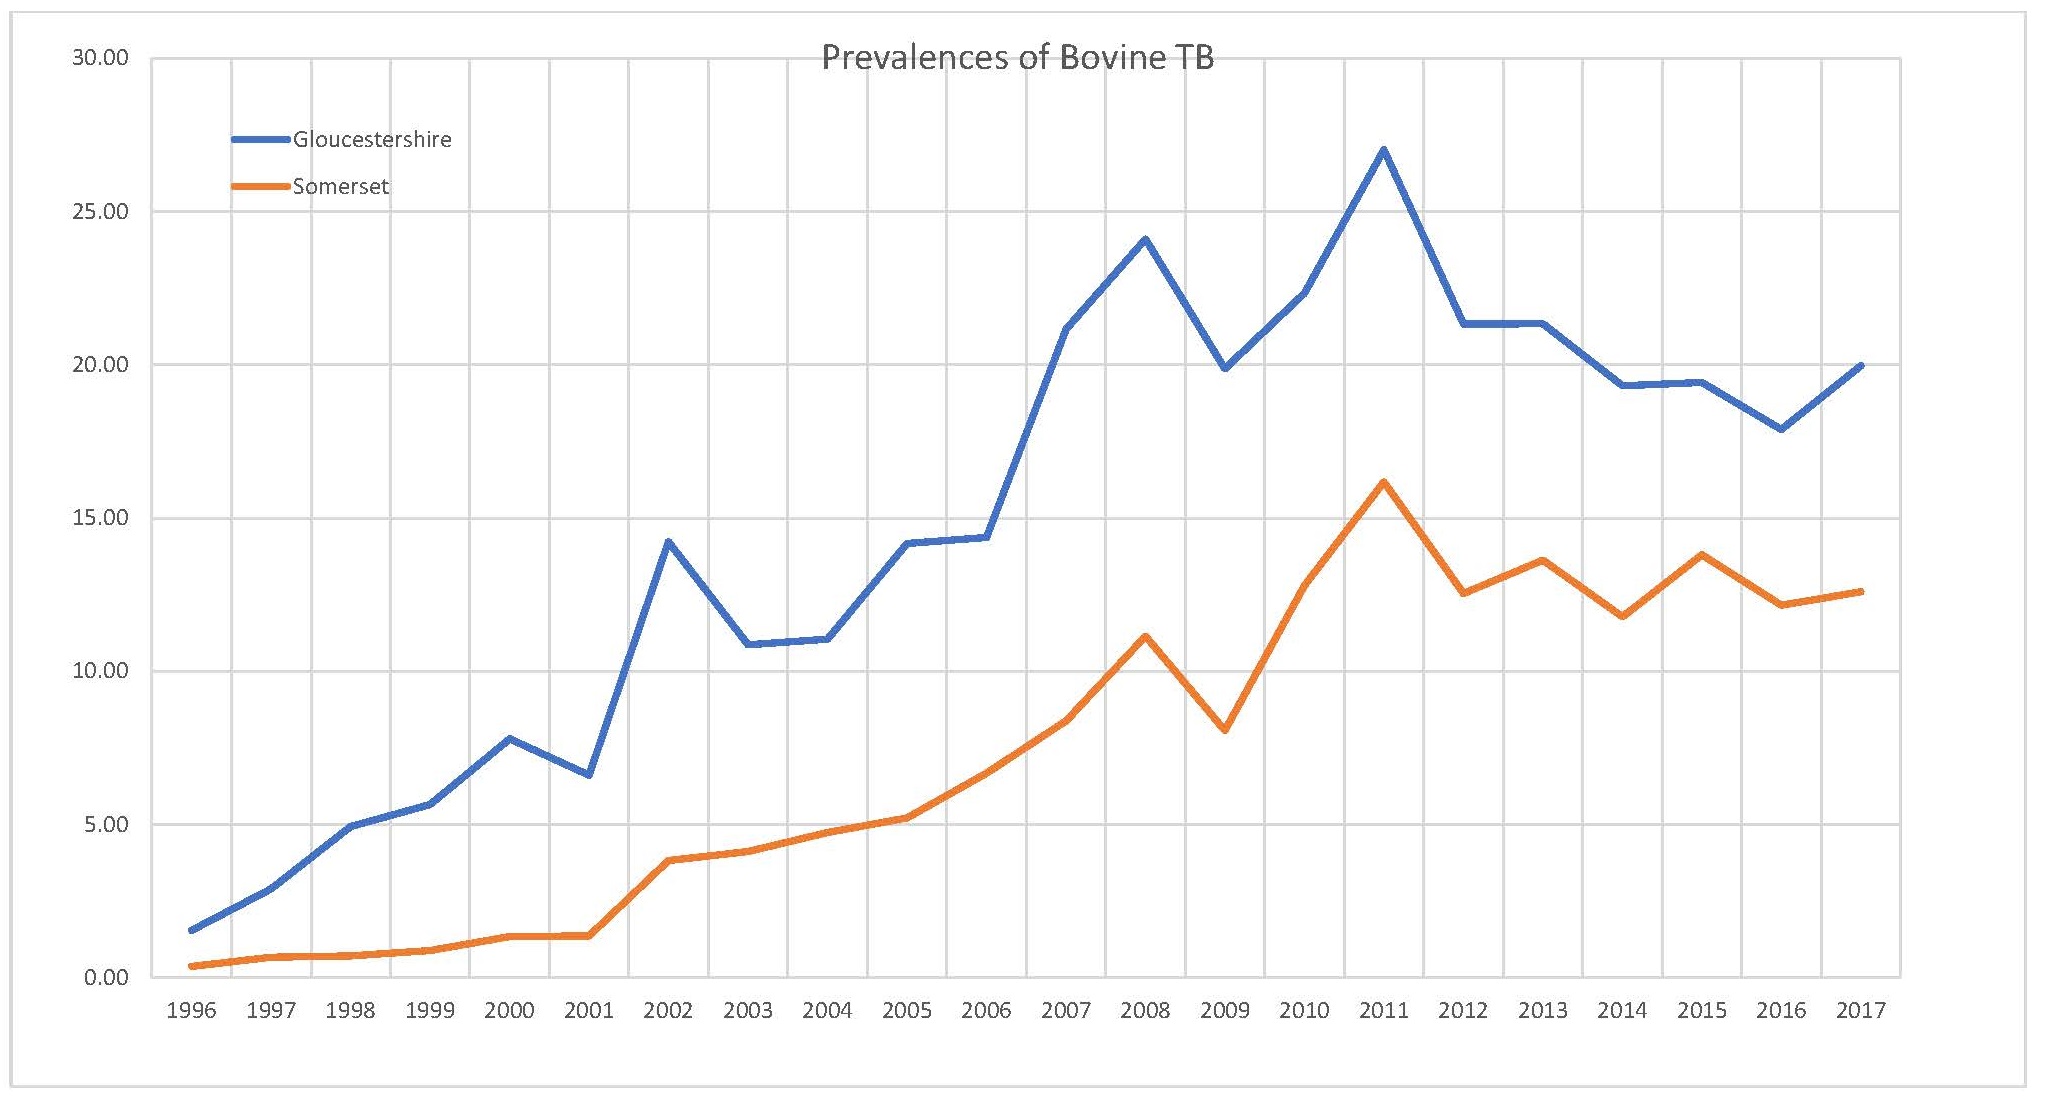
Here are the graphs for Gloucestershire and Somerset 1996 until 2017:

Maximise the graph


George Eusticen also states:


“Today the Animal and Plant Health Agency has published data showing there has been a drop in TB incidence in the first two cull areas where the number of new confirmed breakdowns has dropped by around 50%. In Gloucestershire the incidence rate has dropped from 10.4% before culling began to 5.6% in the twelve months following the fourth cull. While in Somerset it has dropped from 24% to 12%.”

What is incidence and what are incidents.


I think, that we have to be exact with the terms. Incidents (mind the spelling) rate and incidence is not the same. In the file “bovinetb-southwest-17oct18.ods” provided by APHA and government incidents are: “New herd incidents where OTF status was withdrawn from the herd.”

If new incidents of Bovine TB are decreasing, the disease is perhaps spreading slower, but there is no effect on the incidence or prevalence of bovine TB (Percentage of farms with no OTF-status) So there is not yet a proof that badger culling is decreasing incidence or prevalence of Bovine TB.

So we are not on the way to an incidence or prevalence of Bovine TB under 1% until 2038 or whenever.